Plotting room temperature and humidity using Prometheus, Grafana and a DHT11 sensor
Jul 22, 2018Last week we installed an airconditioning unit in our house and yesterday a DHT11 humidity and temperature sensor arrived that I had ordered in the past from ebay and had totally forgotten about it. So, I got the idea to monitor the temperature and humidity in the room, to see how well the airconditioning unit works.
What better way to do this than use Prometheus, Grafana and a spare Raspverry Pi Zero W I had lying around.
Architecture
My prometheus server runs in a docker container, which in turn runs in a KVM, which in turn (squared) runs in a physical host I maintain at online.net. I use a VPN to connect all of my hosts and node_exporter is configured to only listen on the VPN interface.
I initially planned on using a cheap NodeMCU/esp8266 board to interface with the sensor and write a simple exporter in the prometheus format. I quickly scraped that idea because I'm using NAT at home and I would either have to do port forwarding or have my router be a part of the VPN and assign IPs in the VPN address space.
I opted for the simpler solution, use a Raspberry Pi and just have it be a client to the VPN. This also meant I got to test DebOps on armv6 based devices.
Implementation
The implementation was easier than I expected. I run my DebOps-related playbooks, modified some parts to work on armv6, soldered some male pin headers to the raspi and connected the sensor to power/ground and a GPIO pin.
To interface with the sensor, I used a python library by Adafruit and for exporting the metrics I used the official python prometheus client. Nothing fancy here, just hardcoded some glue code and had it run automatically on startup.
from prometheus_client import start_http_server, Gauge
import Adafruit_DHT

t = Gauge('temperature', 'Temperature')
h = Gauge('humidity', 'Humidity')

start_http_server(9222)
while True:
    humidity, temperature = Adafruit_DHT.read_retry(11, 4)
    t.set(temperature)
    h.set(humidity)
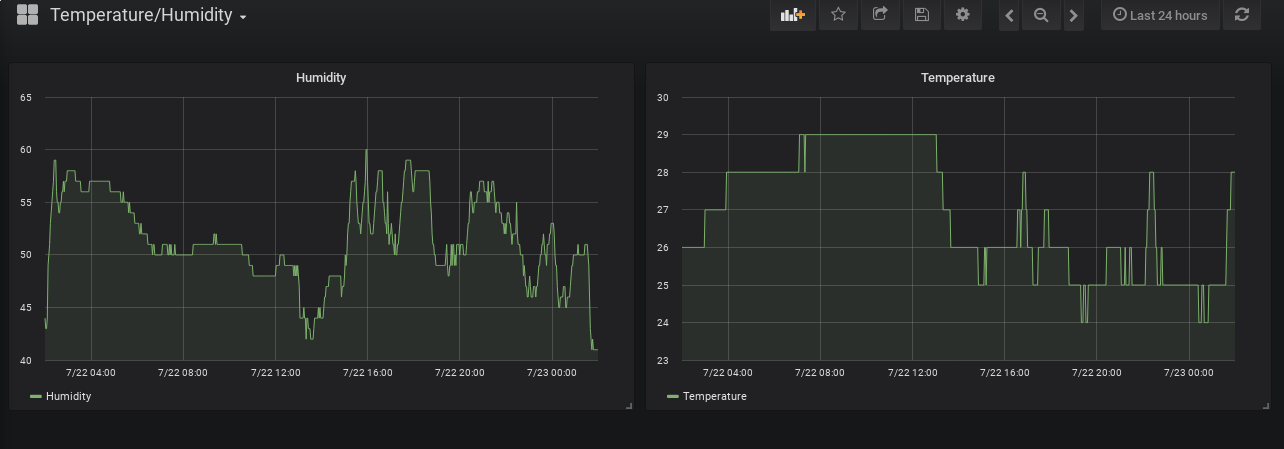
Here is a screenshot showcasing the end result plotted in Grafana, where you can clearly see when we turned on/off the AC unit.
Source: GitHub